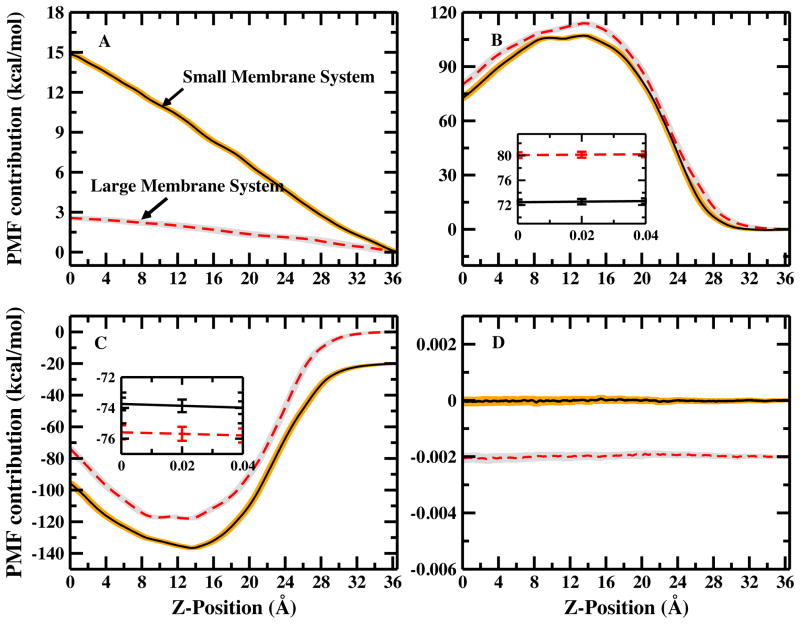
FIG. 3.
Decomposition of the PMF. Solid curves represent small membrane system, dashed curves represent large membrane system. (A) Ion contribution; (B) Water contribution from large and small membrane systems; (C) Membrane contribution and the solid curve is shifted by −20.0 kcal/mol; no shift in the inset figure; (D) arginine self-contribution, and the solid curve is shifted by −0.002 kcal/mol for clarity. Shades indicates the uncertainty.

