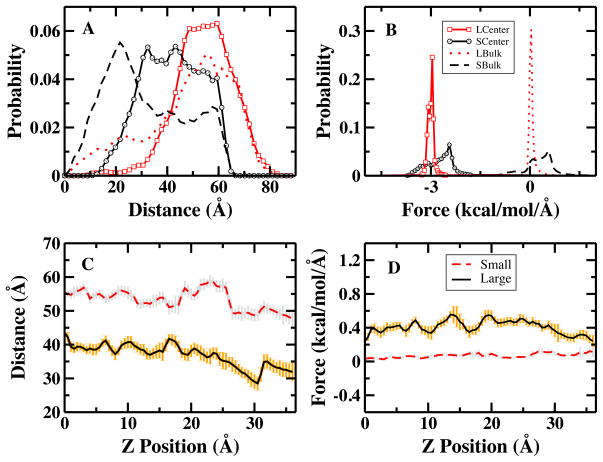
FIG. 4.
LCenter (SCenter): the center of bilayer windows [−1.5: 1.5] Å in the large (small) membrane system; LBulk (SBulk): the bulk water windows [33.5: 36.5] Å in the large (small) membrane system. (A) the distribution of the distance between chloride and guanidinium carbon; (B) the distribution of the force acting on arginines from ion in both systems, the solid lines show the center of bilayer windows, shifted by −3 kcal/mol/Å for clarification, and dash and dotted lines show the bulk water windows; In figures C and D, dash line: small membrane system; solid line: large membrane system. (C)the average distance between ion and guanidinium carbon; (D) the average force along the reaction coordinate.

