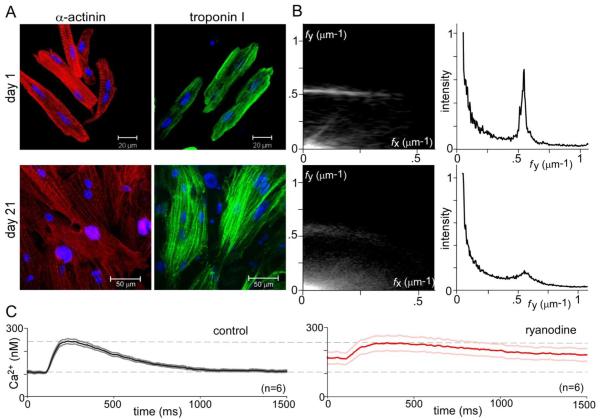
Fig. 1.
Myofibrillar organization and Ca2+ cycling in acute versus syncytial aGPVM cultures. A: Immunocytochemical images showing α-actinin (red) and troponin I (green) in acute aGPVMs (day 1, top row) and syncytial aGPVM cultures (21 days, bottom row). Nuclei of each cell stained by DAPI (blue). B: Two-dimensional spatial Fourier analysis of α-actinin images, averaged over multiple coverslips (top row, acute, n = 15; bottom row, syncytial cultures n = 16). Left, magnitude of Fourier components (brightness) as a function of spatial frequency along long major (fy) and orthogonal minor (fx) axes. Right, histogram representation of magnitude of Fourier components along fy, after summing over all fx. C: Cytosolic Ca2+ transients of syncytial aGPVM cultures obtained during 0.5 Hz field stimulation, as reported by Indo-1. Average response before (left, dark black) and after (right, dark red, n = 6) addition of ryanodine (10 μM), an inhibitor of RyRs. Gray (left) and pink (right) indicate ± SEM.

