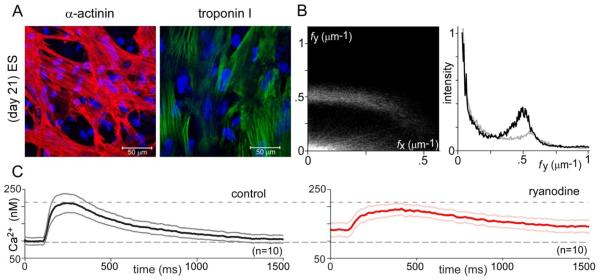
Fig. 4.
Improved myofibrillar organization and maintained Ca2+ cycling of syncytial aGPVM cultures exposed to electrical stimulatory cue. Format identical to that in Fig. 1. A, B: Enhanced myofibrillar organization, most obviously apparent from larger and more distinct peak in B at fy ~ 0.5 μm−1 (black relation, averaged from n = 17 monolayers). For reference, gray relation is control histogram of culture without stimulatory cue, reproduced from Fig. 1B. C: Unchanged global Ca2+ cycling.

