Fig 6.
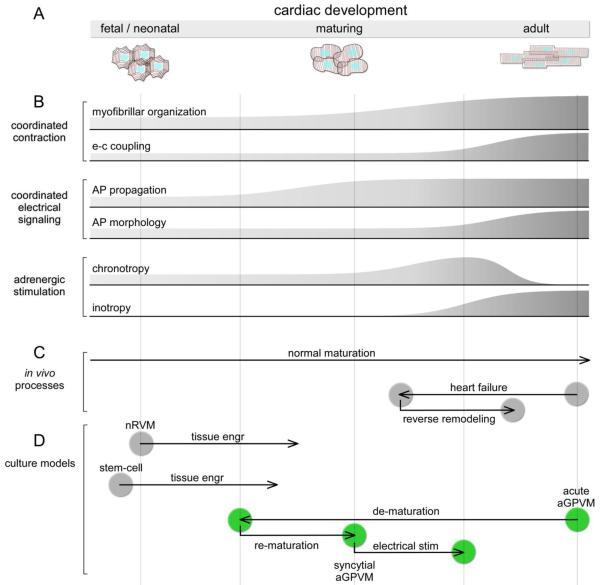
Spectrum of cardiac development and correspondence to various in vivo processes and culture models. A: Schematic and names of various epochs in cardiac development; cartoons of coarse cell-morphologic features for cardiac ventricular myocytes in various stages. B: Stylized graphical representation of various phenotypic limbs corresponding to development. C: Normal and heart-failure processes diagrammed with approximate registration to developmental spectrum (A) and phenotypic events (B). D: Approximate positions of various cultured cardiomyocyte systems. Green corresponds to aGPVM system, showing overlap with key events and positions of presumed heart-failure and reverse remodeling trajectories (C).

