Figure 5.

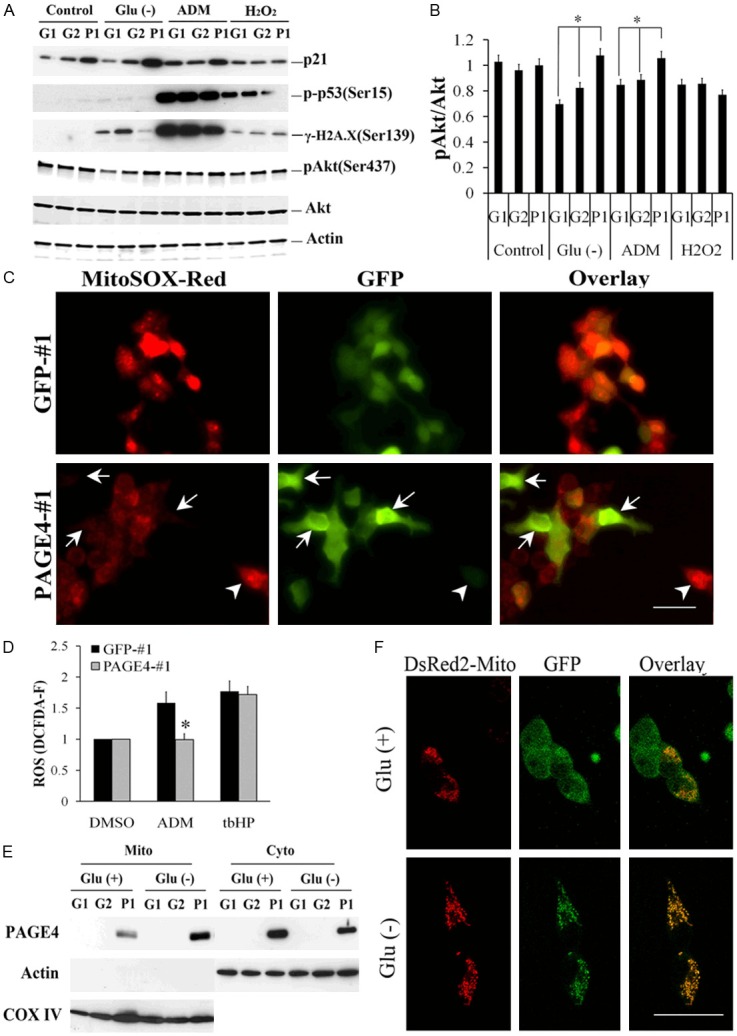
PAGE4 protects DNA damage and transfers to mitochondria upon glucose deprivation. A: CWR22rv1 cells overexpressing PAGE4 (P1) or GFP (G1 and G2) were cultured in medium with (+) or without (-) glucose (Glu) for 48 h, or treated with 1 μg/mL of ADM for 4 hr, or treated with 200 μM of H2O2 for 45 min followed by recovering in normal medium for 24 hr. Cells were then collected, and cell lysate were subjected to Western blot. B: Quantitative analysis of expression of p-AKT relative to actin. C: CWR22rv1 cells were transfected with either GFP (GFP-#1) or GFP-tagged PAGE4 (PAGE4-#1), and then cultured in the medium without glucose supplement for 48 hr. Cells were stained with MitoSOXTM Red and observed under fluorescence microscopy. Arrows indicate cells that highly express PAGE4 (green) but generate low ROS (red), while arrowheads indicate cells with high ROS level but low PAGE4 level. D: GFP-#1 and PAGE4- #1 cells were treated with 1 μg/mL of ADM or DMSO for 2 hr, and then ROS levels were measured. tbHP 50 μM was used as positive control. All the values are presented as relative to GFP-#1-DMSO. E: Cells were cultured with or without glucose supplement for 48 hr, and mitochondrial component were isolated. Cytoplasmic fractions (Cyto) and mitochondrial fractions (Mito) of cell lysate were subjected to Western blot. Actin level is used as protein loading control for Cyto component, while COX IV is used as a loading control for Mito component. F: PAGE4-#1 cells were transfected with pDsRed2-Mito and then cultured in the medium with or without glucose supplement for 48 hr. Localization of mitochondrial (red) and PAGE4 (green) were observed under confocal fluorescence microscopy. Data are represented as mean±SD. All experiments were repeated at a minimum of three times. An asterisk indicates P<0.05 compared to control cells. Scale bars in all panels, 10 μm.
