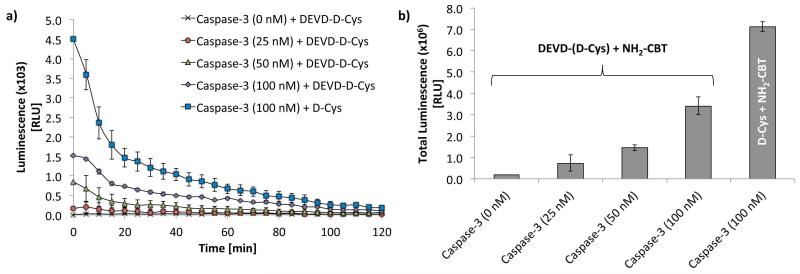
Figure 5. Quantification of caspase-3 activity in test-tube assay using “split luciferin approach”.
(a) Bioluminescent signal as a function of time from DEVD-(D-Cys) peptide (200 μM) or D-cysteine (200 μM) after incubation with different concentrations of Caspase-3 (25, 50 and 100nM) over 3 h at 37°C, followed by addition of NH2-CBT (400 μM in MeOH), and incubation for additional 1 h at 37°C. The signal acquisition was started immediately after addition of 5 μL of the pre-made luciferase buffer (see recipe) and acquired for the duration of 2 h using IVIS Spectrum (Perkin Elmer, USA). (Error bars are ± SD for three measurements). (b) Total light output collected over the period of 2 h (performed by integrating the area under the curves in panel A and plotted in the form of bar-graph. Adapted with permission from Godinat, A., Park, H. M., Miller, S. C., Cheng, K., Hanahan, D., Sanman, L. E., Bogyo, M., Yu, A., Nikitin, G. N., Stahl, A., Dubikovskaya, E. A. 2013 A Biocompatible In Vivo Ligation Reaction and its Application for Non-Invasive Bioluminescent Imaging of Protease Activity in Living Mice, ACS Chem. Biol. 8, 987–999. Copyright 2014 American Chemical Society.

