
Figure 1.
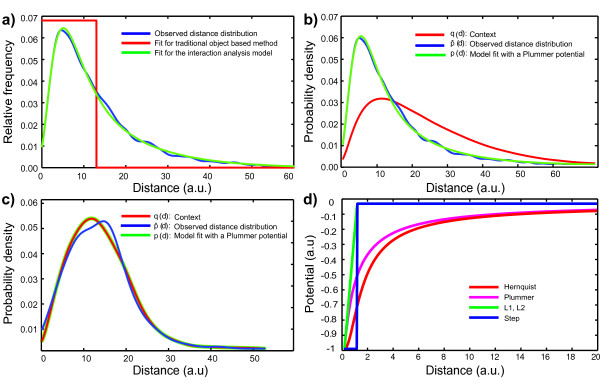
Interaction analysis with smooth potentials and context correction. (a) Example comparison of fits to data (blue) using traditional, uncorrected object-based co-localization analysis (red) and using the context-corrected method used in MosaicIA (green). The plots show the nearest-neighbor (NN) distance distribution between two arbitrary point patterns. (b,c) Sample fits corresponding to interacting and non-interacting point patterns, respectively. In the case of the non-interacting point pattern, the model fit (green) to the observed NN distribution (blue) coincides with the context (red). In the presence of an interaction, the NN distance distribution (blue) is different from the context (red). The difference is explained by an interaction potential, leading to the model fit (green). (d) Shapes of different potentials provided by MosaicIA. Parameters: σ =v1, and t = 0 for all except step potential, where σ = t = 1.