
Figure 2.
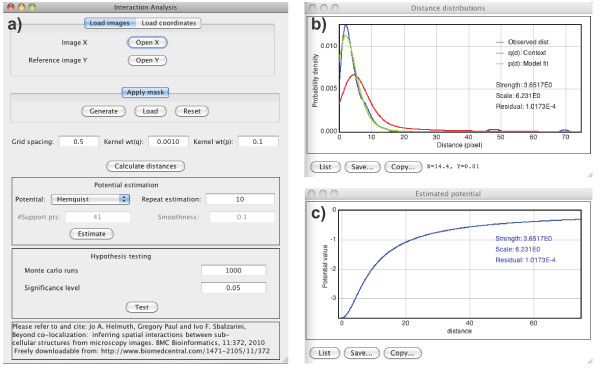
The graphical user interface of the plugin. (a) The main mask of MosaicIA where the parameters are entered. (b,c) Windows showing example results of an analysis. The measured and fitted NN distance distributions, along with the context, are shown in (b). The interaction potential leading to the displayed fit is shown in (c).