
Figure 4.
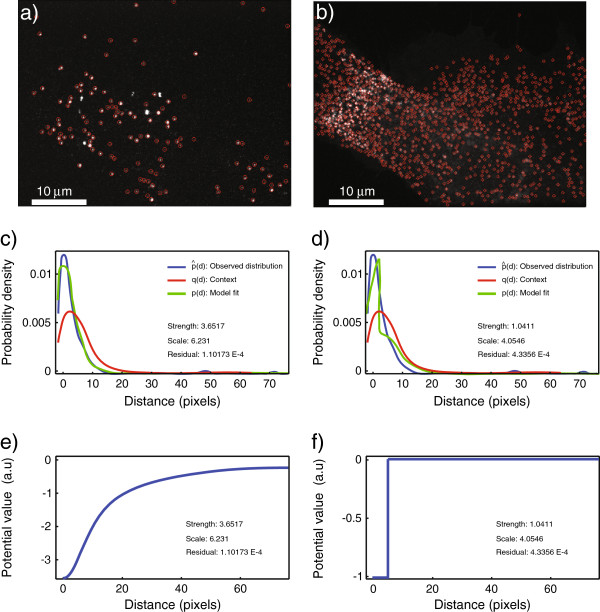
Results of applying the plugin to virus–endosome data from confocal microscopy. (a) Image X of the red channel showing adenovirus serotype 2 (Ad2) tagged with ATTO-647. (b) Image Y of the green channel showing Rab5-EGFP, a marker for endosomes. The results from object detection using MosaicIA are shown as overlaid red circles. Only a single 2D image is used here, and no z-stack. (c,d) Distance distributions obtained after fitting the data with a Plummer and step potential model, respectively. (e,f) The corresponding estimated interaction potentials. The Plummer potential leads to a 4-fold lower fitting error than the step potential.