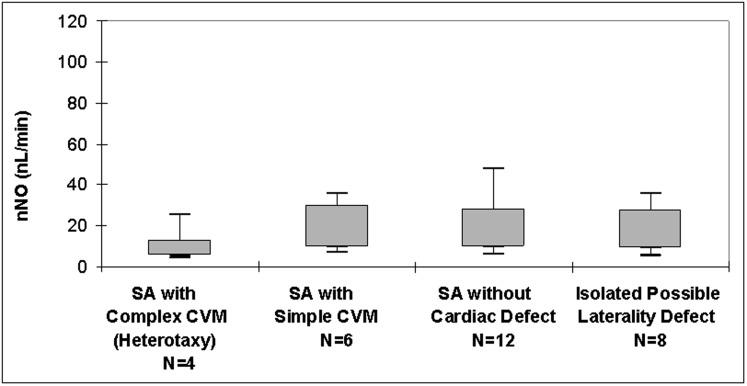
Figure 4 –
Measurements of nNO in SA subgroups with classic primary cilia dyskinesia. Shown are nNO values by velum closure in participants with SA according to SA subgroup. Box plots show interquartile range, with median denoted by bold line. Whiskers denote minimum to maximum values. SA = situs ambiguus. See Figure 2 legend for expansion of other abbreviations.

