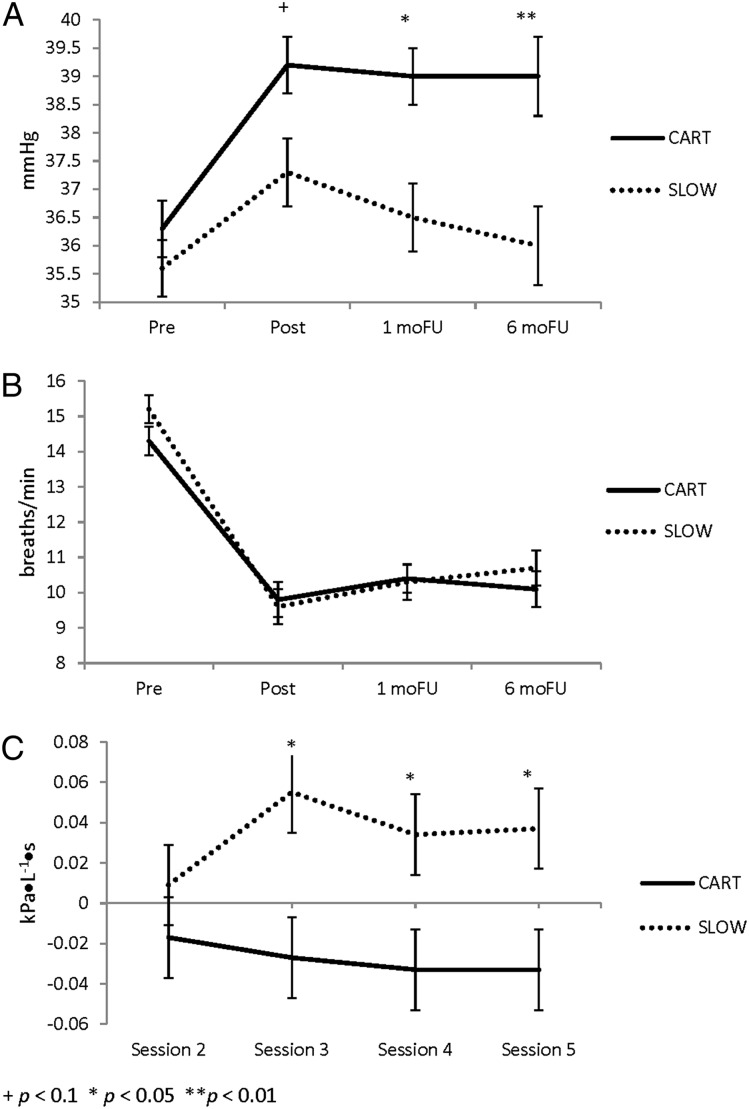
Figure 2 –
A-C, Changes in end-tidal Pco2 (A), respiratory rate (B), and respiratory impedance (C) (from initial assessment at treatment session 1). 1moFU = 1-mo follow-up; 6moFU = 6-mo follow-up. See Figure 1 legend for expansion of other abbreviations.

