
Figure 10.
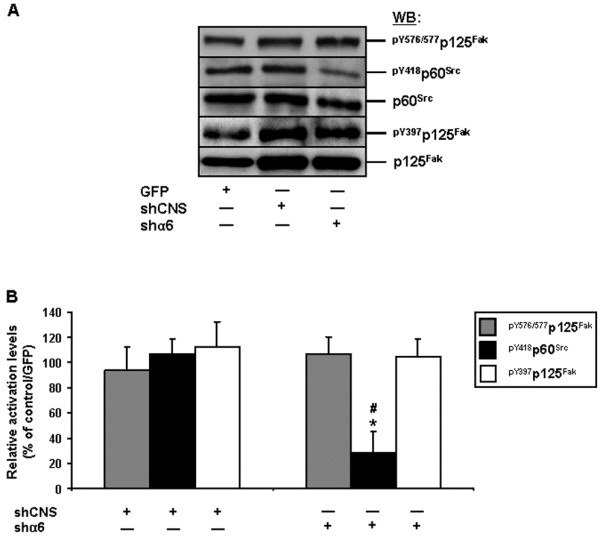
Impact of the knockdown of the α6 integrin subunit on Fak and Src activation, in human IECs. A. Representative (n ≥ 3) WB analyses of Src and Fak, and verifications of Fak-Src interactions, from adhering HIEC cell cultures following their infection by a lentivirus carrying GFP (control), shCNS or shα6. Specific antibodies for pY576/577p125Fak, pY418p60Src and pY397p125Fak, as well as for respective total protein forms, were used. B. Adhering HIEC cell cultures were infected and processed as in (A), except that the relative pY576/577 levels of Fak (grey columns), as well as the relative activation levels of Src (filled columns) and Fak (open columns), were established in comparison to controls. Statistically significant (0.0001 ≤ P ≤ 0.001; n ≥ 3) differences between treated and control cultures are indicated by (*). Statistically significant (0.0005 ≤ P ≤ 0.005; n ≥ 3) differences between shα6 and shCNS are indicated by (#). A-B. Results obtained with -2PC Caco-2/15 cells were highly similar to those shown here for HIEC cells.