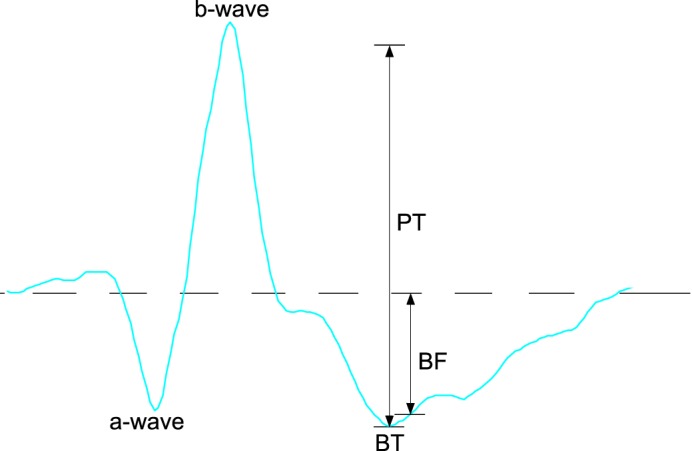
Figure 1.

Illustration of measurement methods from the ERG waveform (2.25 cd.s/m2): a-wave measured from prestimulus baseline to first negative trough. The b-wave measured from a-wave to positive peak. The PhNR amplitude was measured from prestimulus baseline to negative trough following B-wave (BT), prestimulus baseline to fixed time point of 75 ms (BF), and B-wave to negative trough following B-wave (PT).
