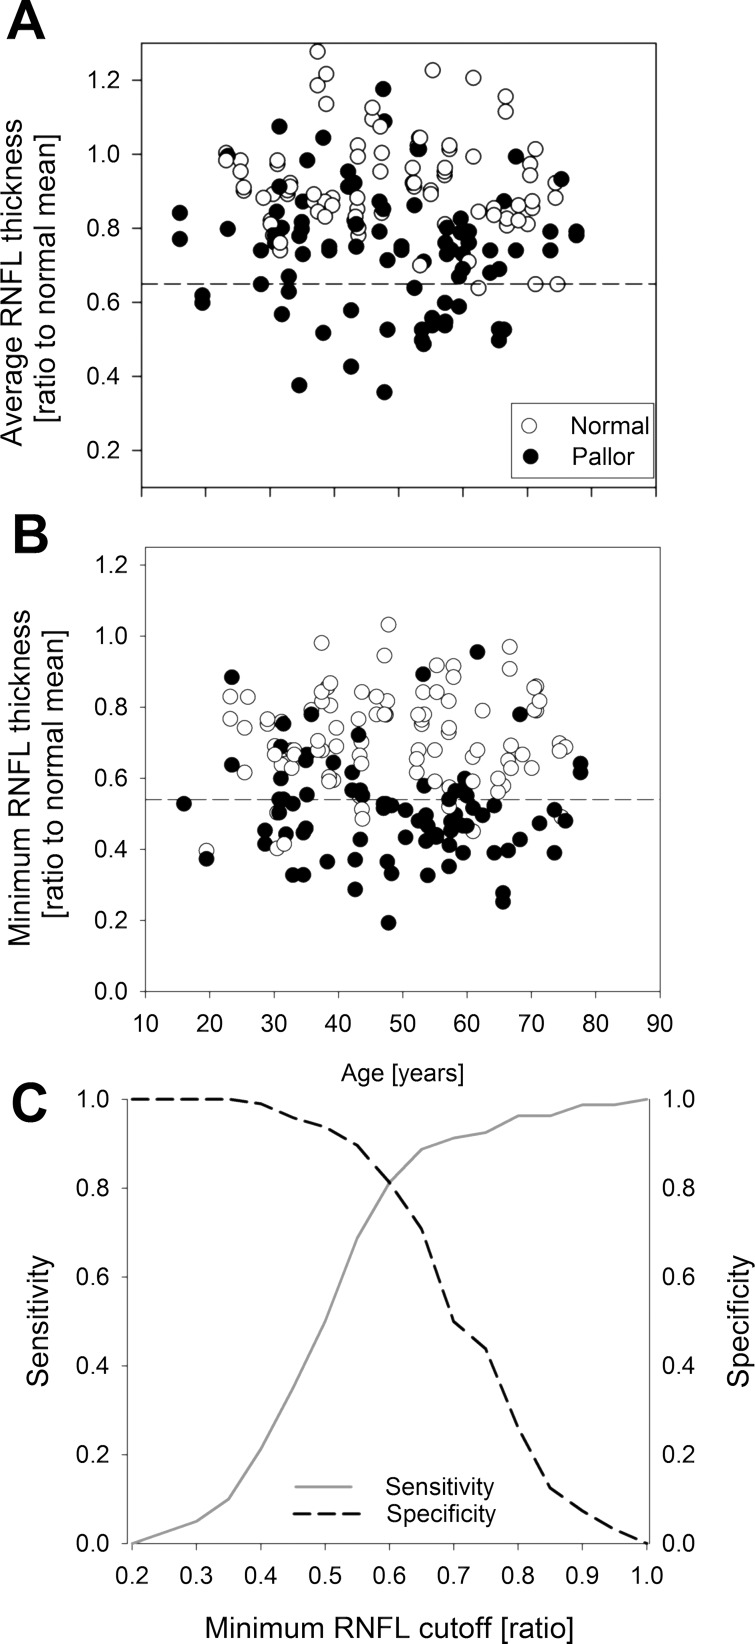
Figure 1.
Mean peripapillary (A) and minimum sector (B) RNFL thickness plotted against age for each eye for all patients who met the inclusion criteria. Values are expressed as ratios to published (Seibold et al.16) normal mean thickness for each OCT system and location (mean peripapillary and minimum sector thickness). Dashed line denotes mean −2SD for each RNFL thickness parameter. (C) The receiving operating characteristic curves for sensitivity and specificity for optic nerve pallor as a discriminator between eyes with RNFL thinning and eyes with normal RNFL.

