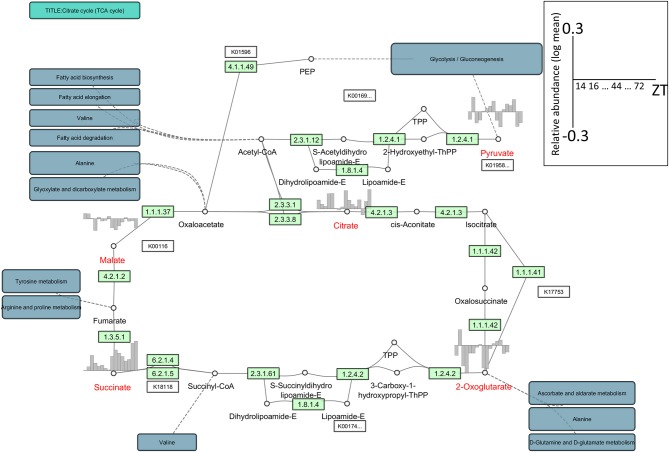
Figure 1.
An example of the network representation of time-series metabolome data in Arabidopsis using KEGGscape (http://apps.cytoscape.org/apps/keggscape). The datasets were sampled with 4-h resolution under a 16 h/8 h light/dark cycle at 20°C (Espinoza et al., 2010). We used the KEGG pathway map (ath00020), the tricarboxylic acid (TCA) cycle, or the citrate cycle. We queried MetMask (Redestig et al., 2010) for a list of KEGG compound IDs associated with a list of predefined metabolite names and picked up the most pathway-mapped KEGG compound ID for each metabolite. Metabolite names shown in red represent detected compounds in the dataset. The diurnal changes were visualized on bar charts ranging from −0.3 to 0.3 in log-mean values. ZT, Zeitgeber time.

