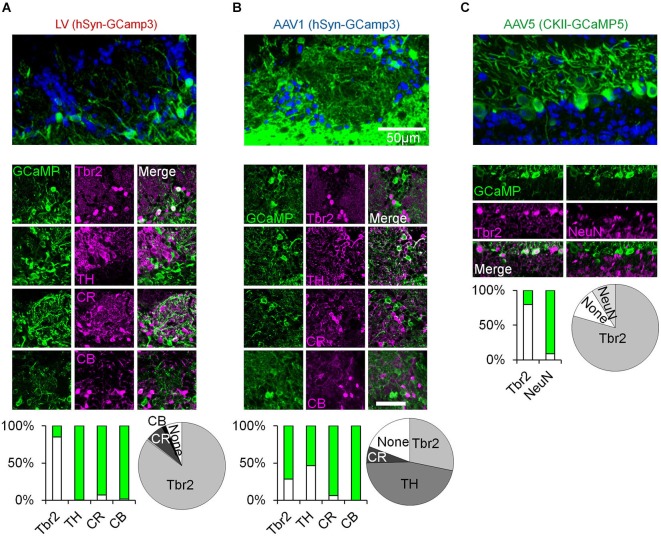
Figure 1.
Immunohistochemical analysis of OB cell types labeled with distinct viral vectors. (A–C) Top, confocal micrographs from the OB following virus injection. Middle, representative images of GCaMP expression and its overlap with Tbr2 (Winpenny et al., 2011), TH, Calretinin (CR), and Calbindin (CB) positive neurons (Parrish-Aungst et al., 2007; Adam and Mizrahi, 2011). Green images—expression of GCaMP. Magenta images—Staining with antibodies against the indicated marker. Merged images—double labeling of GCaMP and the respective marker. Bar graphs—percent of double labeling between GCaMP and the indicated marker (Green = GCaMP positive and marker negative, white = GCaMP positive and marker positive). Pie charts—summary of the composition of each sample (based on the bar graphs). LV—Lentivirus, AAV—adeno-associated virus, hSyn—human synapsin promoter, CKII—CamKII promoter. Tbr2—T-Brain gene 2, TH—tyrosine hydroxylase, CR—calretinin, CB—calbindin, NeuN—neuronal nuclear marker.

