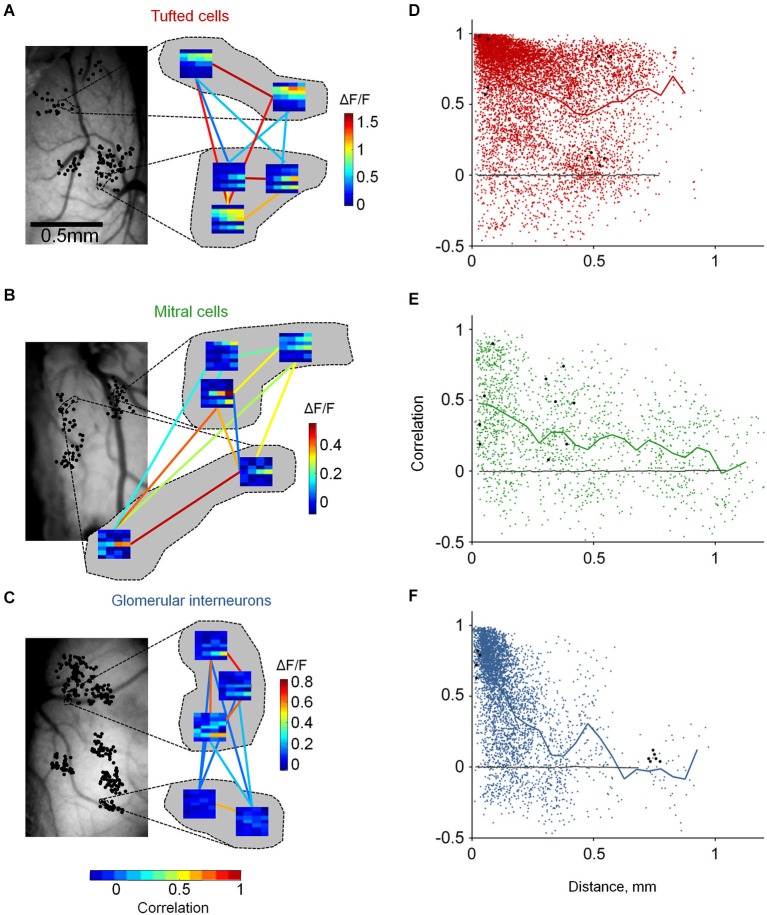
Figure 4.
Distinct functional architecture of TCs, GL-INs and MCs. (A)—TCs, (B)—MCs, (C)—GL-INs. Left, still image of the blood vessels on the dorsal surface of the OB. Black dots denote the location of all imaged cells (in a 2D dorsal view). Dashed lines mark the location of the cells which their enlarged response profiles are shown on the right. Right, examples of response profiles from five neurons in each OB. Each row represent one odor (1-E-Acet, 2-M-Prop, 3-Prop, 4-But, 5-E-But, 6-Pent, 7-E-Tig), and each column represents a single concentration (5, 10, 25, 50 ppm). Color-code (vertical) is the max ΔF/F in each condition. Colored lines represent the signal correlation between the connected cells, represented by the horizontal color bar. (D)—TCs, (E)—MCs, (F)—GL-INs. Signal correlation between the response profiles of all pairs as a function of the distance between the cells. Thick line—mean correlation averaged in 50 µm bins. Black dots—the example pairs from (A) (B) or (C). Black line—correlation between randomly shuffled response profiles. TCs: n = 8755 pairs from n = 306 active neurons in six OBs, GL-INs: n = 4128 pairs from n = 194 active neurons in six OBs, MCs: n = 1682 pairs from n = 149 active neurons in 10 OBs.

