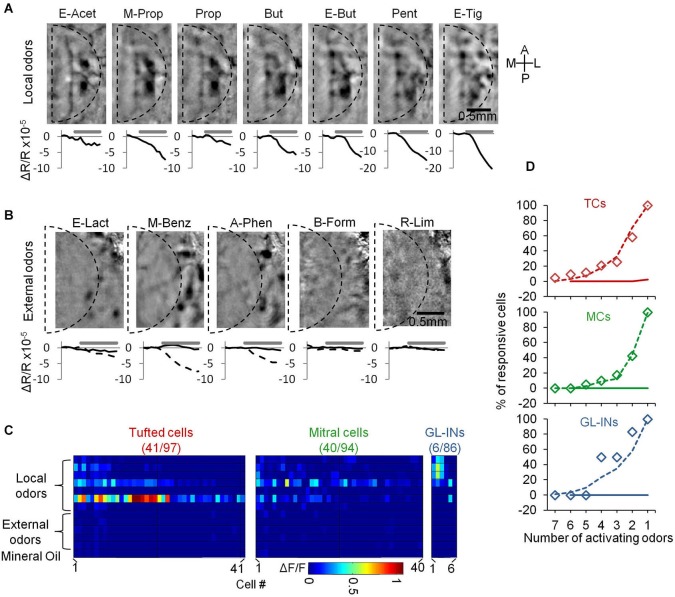
Figure 5.
Neurons from the dorsal surface are not activated by distant glomeruli. (A) Intrinsic signal imaging maps showing activation by the panel of odorants used in this study. The borders of a standard chronic imaging window are denoted by the dashed line. Beneath each map we show the dynamics of the intrinsic signal before and during a 4 s stimulus. Signal is the sum intrinsic signal within the dashed line. (B) Same as in (A) but for five “external” odors. Curves in the bottom shows the dynamics of the intrinsic signal within the window (black) and outside the window (dashed). (C) Calcium responses of all responsive neurons that were tested with both “local” and “external” odor sets. Color-code—Peak ΔF/F. Cells in each population are sorted according to the number of activating odorants. Only the responsive cells in each group are presented (total numbers are outlined in the title of each panel). (D) Cumulative graphs of the number of activating odors in each population (responsive cells only). Diamonds—local odors from this dataset, dashed line—local odors in the main dataset (same as Figure 3E), solid line—external odors.

