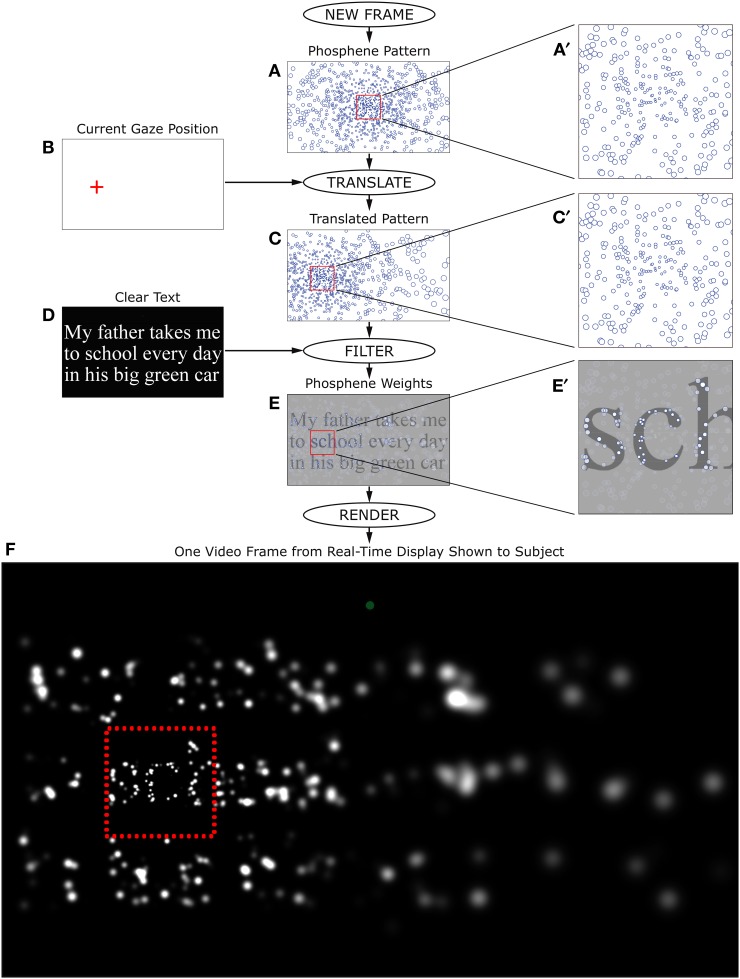
Figure 4.
Real-time stimulus generation. Each frame during the Reading Phase of phosphene vision trials was generated in real time according to the flow chart shown here. The phosphene pattern selected for the trial (A), was translated in visual space so that the location (0, 0) was centered on the instantaneously read gaze position relative to the screen (B), to generate a pattern relative to the point of regard (C). The text for the given trial was then rendered as an off-screen image (D), and the translated pattern of locations overlaid on that image as a set of independent averaging filters. Each phosphene brightness was determined by taking the local average luminance of the text image weighted by a two-dimensional Gaussian filter that was sized according to the eccentricity of the phosphene (see main text). The outputs of individual filters (E) were used to set the brightness of matching-sized Gaussians at the corresponding locations. When phosphenes overlapped, they were combined additively in the final image. After all phosphenes were rendered (F), the entire frame was copied to the video card. Typical processing time for each frame was less than the refresh time of the subject monitor, so that each monitor refresh could contain a new update, and thus create a real-time simulation. Since the phosphene pattern was always translated to the point of regard, the procedure had the effect of (coarsely) stabilizing phosphene locations on the retina, matching the expected behavior of a real device (Pezaris and Reid, 2007). The frame generated here corresponds to the example shown in Figure 3.

