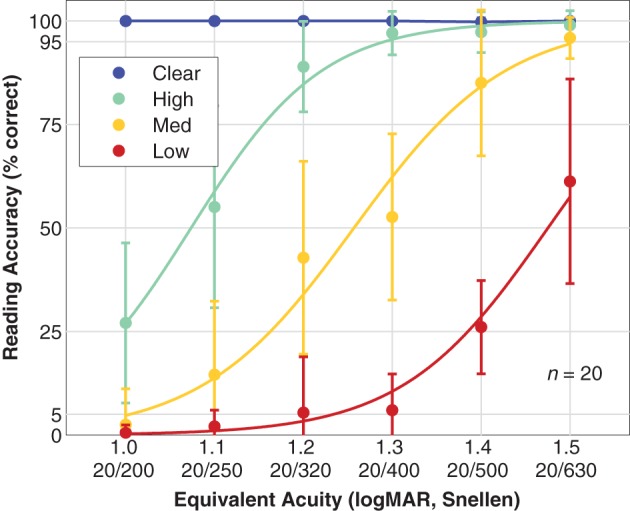
Figure 6.

Reading accuracy. Population reading accuracy vs. font size, expressed as equivalent acuity is shown. Data have been grouped by viewing condition: Clear (blue; text presented in the clear as a control condition), High density phosphene pattern (green), Medium density pattern (yellow), and Low density pattern (red). Data points are the mean, error bars are the standard deviation of population values. Smooth curves are logistic fits with assumed asymptotes of 0 and 100% for all three phosphene vision conditions.
