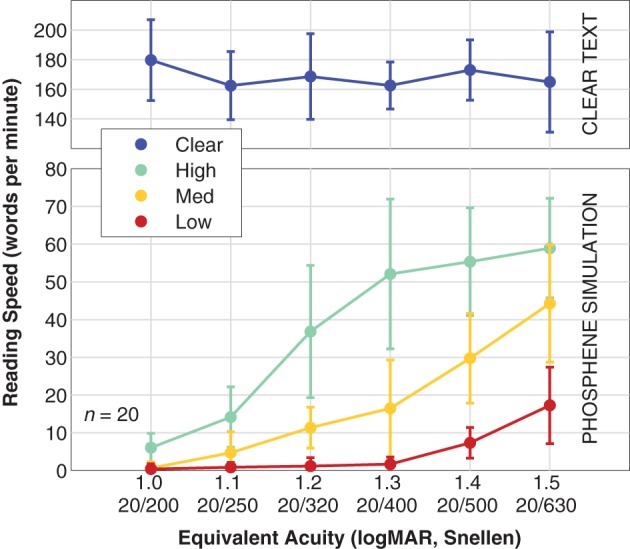
Figure 7.

Reading speed. Population data are shown for reading speed vs. font size (expressed as equivalent acuity), broken down by viewing condition. The upper panel shows the Clear condition where text is shown in the clear as a control (blue). The lower panel shows the results for simulated artificial vision with the three phosphene patterns, High density (green), Medium density (yellow), and Low density (red). Points are the mean, error bars are the standard deviation of population values. The two panels have different vertical scales; the control viewing condition has been separated out to display more detail in the simulation viewing conditions. Logistic fits were not performed with these data as only one condition spanned lower to upper performance plateaus as necessary for a valid fit, and we do not have direct evidence that the asymptotes are identical for all three conditions. As at least two curves would be necessary for meaningful comparisons, a fit for the High data is not shown.
