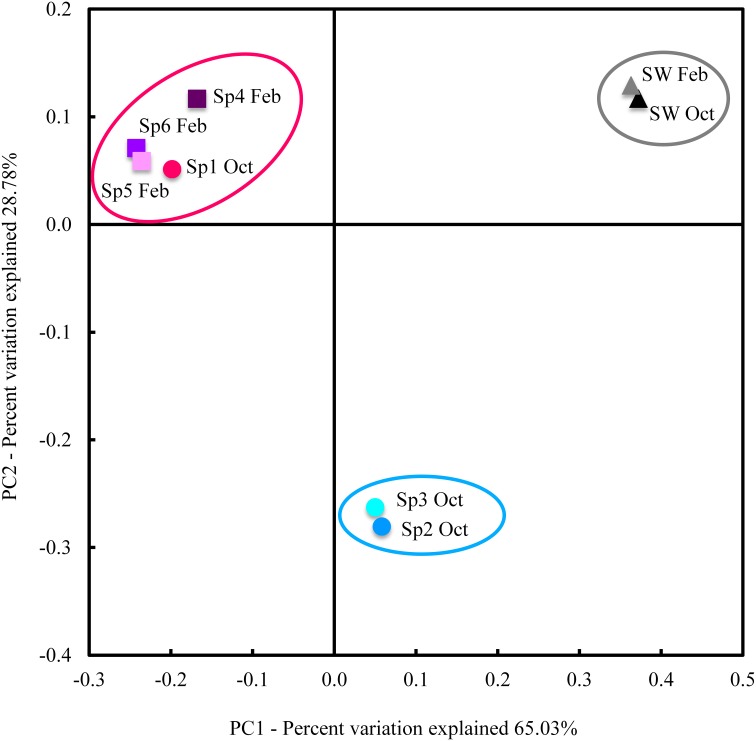
Figure 1.
PCoA analysis of weighted UniFrac distance. UniFrac measures phylogenetic distances between OTUs sets within a phylogenetic tree. Here, we used weighted UniFrac, which takes into account relative abundances of OTUs (as opposed to presence/absence only). Samples formed three groups: a seawater group (samples circled in gray), SG1 (samples circled in red) and SG2 (samples circled in blue). Ovals circling samples are for visual guidance and do not represent any statistical grouping.

