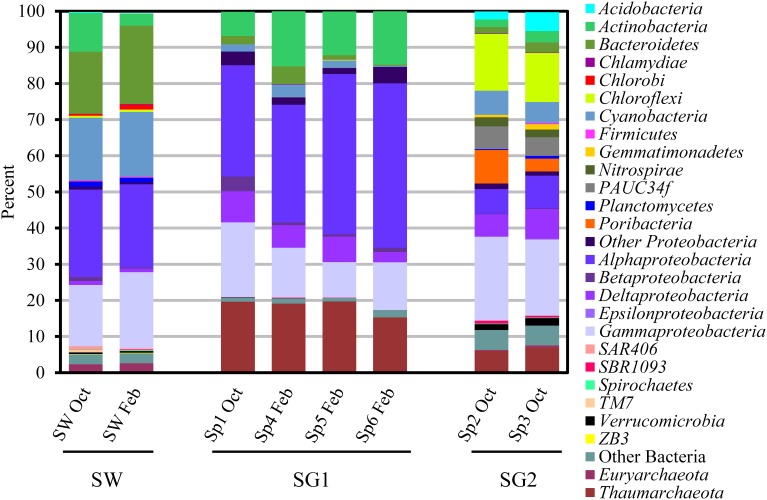
Figure 2.
Relative abundance of pyrosequencing reads at the phylum (or classes in the case of Proteobacteria) level present in six sponges (Sp1- 6: sponge 1- 6) and seawater (SW) samples collected in October 2011 (Oct) and February 2012 (Feb). Phyla comprised of <0.1% of sequences per sample are not shown. Based on the microbial community structure, samples were placed into two groups: sponge group 1 (SG1: Sp1 Oct, Sp4 Feb, Sp5 Feb and Sp6 Feb) and sponge group 2 (SG2: Sp2 Oct and Sp3 Oct).

