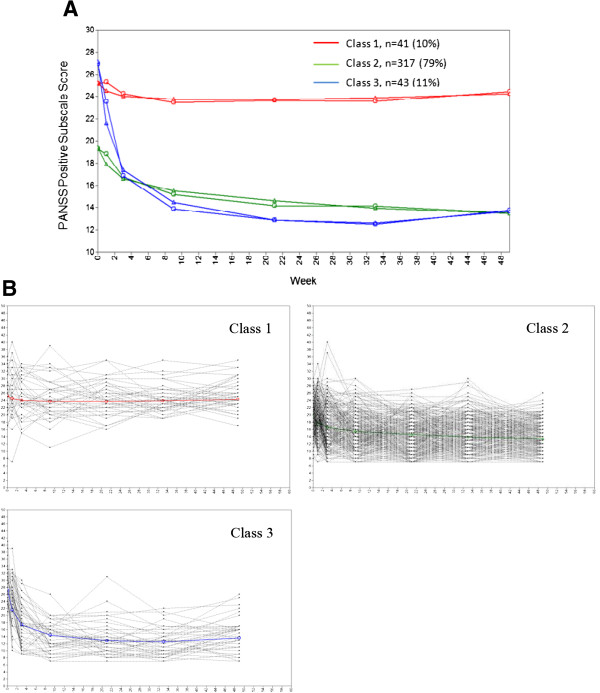
Figure 2.

Positive symptom trajectories. A: Estimated and observed mean curves. Triangles indicate estimated means, and circles indicate observed means. B: Individual profiles by positive symptom trajectories. Light gray lines show trajectory of positive symptom subscale for each patient in each latent class. Bold lines show observed mean trajectories of the corresponding latent classes.
