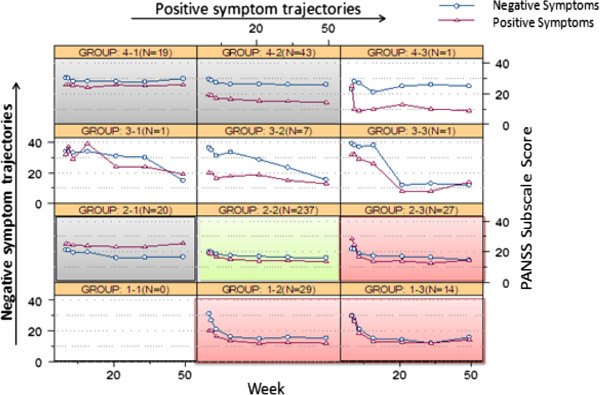
Figure 3.

Interplay matrix of negative and positive symptom trajectories. Abbreviations: DSI = dramatic and sustained early improvement, MSI = mild and sustained improvement, NI = no improvement. The pink cells reflect DSI, the green cells reflect MSI, the gray cells reflect NI, and the uncolored cells reflect idiosyncratic trajectories.
