
Figure 1.
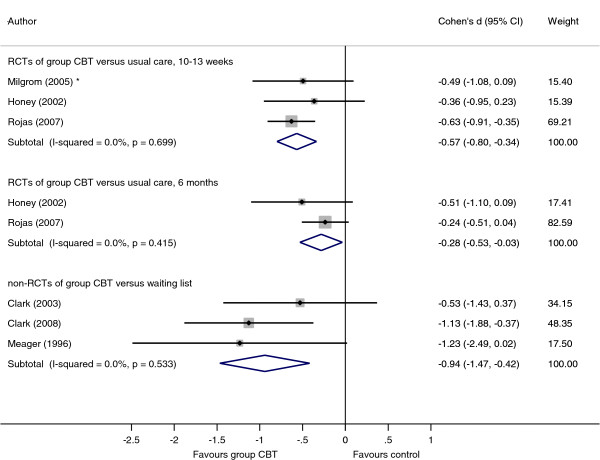
Forest plot to show meta-analyses for three subgroups: i) group CBT versus usual care between 10–13 weeks; ii) group CBT versus usual care at 6 months; and iii) group CBT at versus waiting list between 10–13 weeks. Footnote: Effect sizes in subgroups i) and ii) are calculated from EPDS scale with the exception of * which used BDI inventory. Effect sizes in subgroups iii) used BDI inventory.