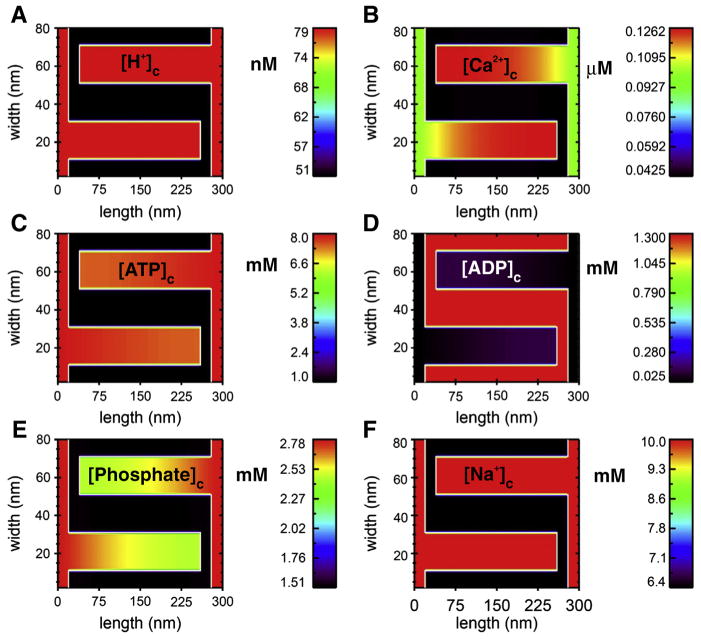
Fig. 5.
Diffusion down the length of cristae modeled as a 2D structure. Using a simple two-dimensional transport model (based on the study of Nguyen, Dudycha and Jafri in 2007 [46]) with the mitochondrial geometry of Fig. 4, steady-state crista gradients are shown for 6 solutes in a simulation run to steady state. This model includes the tricarboxylic acid, electron transport chain fluxes, ionic homeostasis (including H+, Ca2+, ATP, ADP, Pi and Na+) and the adenine nucleotide translocase (ANT) among other features [46]. The fluxes are uniformly distributed along the mitochondrial inner membrane (white line in the figure), about 93% of which lies within the cristae in this model (about 78% in the model of Fig. 4). The behavior of these components was modeled after biochemical/biophysical measurements. The maximal fluxes of each of the component were constrained to give appropriate metabolite concentrations, total Krebs cycle fluxes, ATP production, membrane potential, and ionic homeostasis. The outer membrane is assumed to be permeable with respect to the modeled substances and was thus treated as a fixed boundary condition with cytosolic concentrations of metabolites. The sides of the two zoomed-in cristae are treated with periodic boundary conditions to mimic the repeated structures of the mitochondria (see Fig. 4). The images show the steady-state profiles (after 0.5 ms simulation time) of the six solutes under diastolic conditions. A. [H+]c in nM. B. [Ca2+]c in μM. C. [ATP]c in mM. D. [ADP]c in mM. E. [Phosphate]c in mM. F. [Na+]c in mM. Initial conditions: The intermembrane space adjacent to the outer membrane at the ends of the cristae are assumed to have concentrations equal to the cytosol (i.e. the outer membrane is no permeability barrier for these substances).

