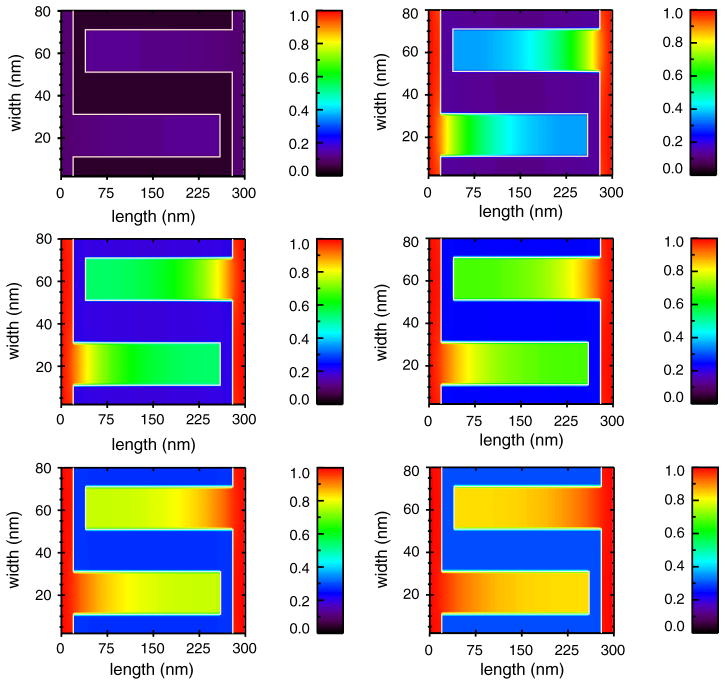
Fig. 6.
Time-course of cristae [Ca2+] ([Ca2+]c) following a 1 μM elevation of [Ca2+]i from 100 nM. Using the same model as in Fig. 5 the time-course of an increase of [Ca2+]c over 0.5 ms in five 0.1 ms steps. Upper left panel: before (0.0 ms, equal to the steady-state conditions from Fig. 5B); lower right panel: after 0.5 ms the diffusion of [Ca2+]c has come to a new steady-state. An animation of this simulation is provided as a Supplemental Material.

