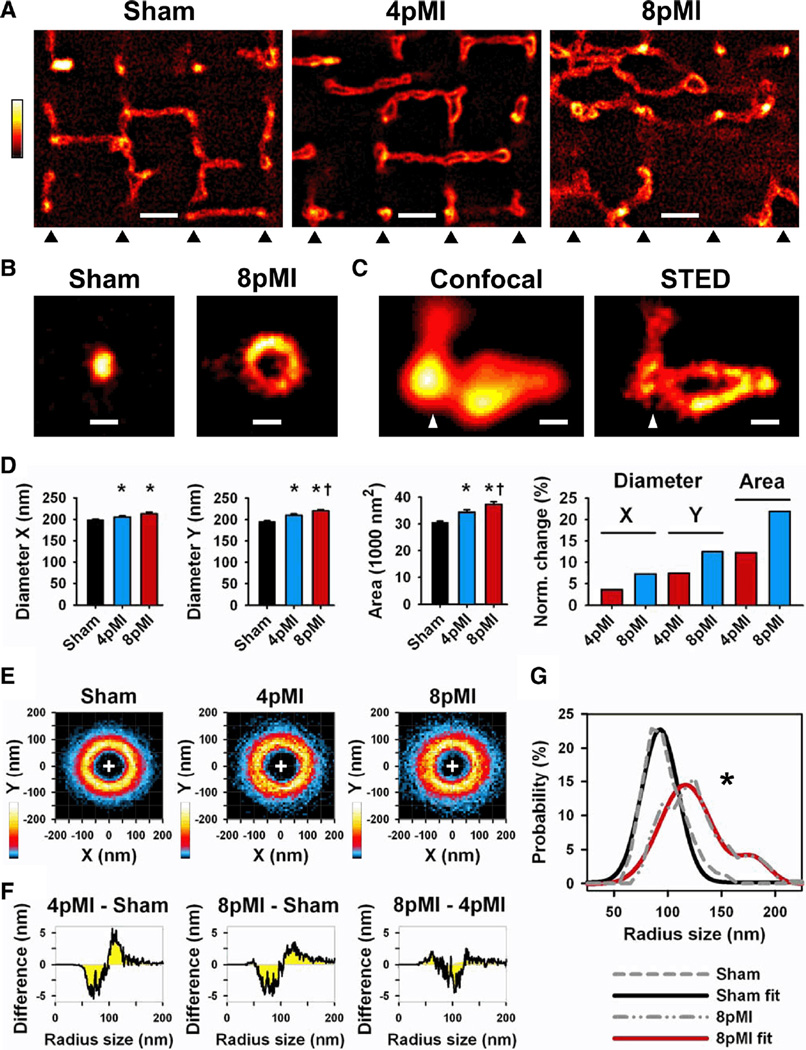
Figure 3. Transversal TT cross sections in intact cardiomyocytes are progressively enlarged through heterogeneous remodeling during HF development.
A, Comparison of striation-aligned STED images showing intracellular TT structures from sham, 4pMI, and 8pMI cells (bottom triangles indicate position of striations). TTs appear enlarged and misaligned in 4pMI and 8pMI cells. Scale, 1 µm. B, STED examples of TT cross sections from sham and 8pMI cells. Scale, 200 nm. C, Confocal versus STED images of a superenlarged TT cross section complex at 4pMI (triangle: position of striation). Scale, 200 nm. D, Longitudinal (X) and transversal (Y) diameters of TT cross sections were determined (see Methods). Bar graphs summarize mean TT diameters X and Y and cross-section area; right, change in TT cross-section dimensions normalized to sham. *P<0.05 versus sham; †P<0.05 versus 4pMI. E, Two-dimensional probability histograms of contours from TT cross-sections of indicated treatment groups (same cross-sections as in D). TT cross-sections were analyzed by automated contour algorithm (see Methods). Colors represent high (white) versus low (black) contour pixel probabilities as indicated. F, Difference integrals were calculated for radius size distributions between the indicated treatment groups. Radius sizes were determined from individual TT contours (see Methods); for example, at 4pMI-sham, a decrease of small versus an increase of large TT radius sizes occurred during HF development. G, Median radius size distributions were calculated from individual TT contours of sham and 8pMI cells (gray dashed lines). The 8pMI distribution is significantly right-shifted (*P<0.05). Furthermore, 2-peak Gaussian fitting of the 8pMI data (red line) confirmed a rightward shift and an additional second peak documenting heterogeneous changes of TT cross-sections. Mean data are summarized in Table 2.

