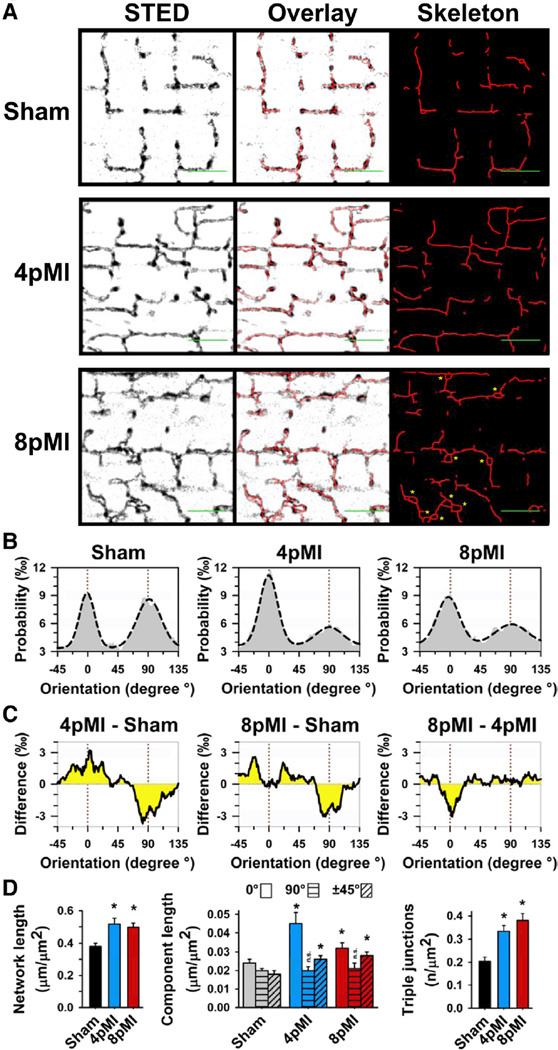
Figure 4. Individual components of the TT network are profoundly remodeled during HF development.
A, Representative TT network grayscale images from sham, 4pMI, and 8pMI cardiomyocytes show STED raw data, overlay of skeleton data, and extracted intact skeleton network data after automated thresholding. In addition, superenlarged TT cross sections were manually evaluated (8pMI: yellow asterisks; see also Results section). Scale bars (green) indicate 2 µm and longitudinal (0°) orientation. B, Probability histograms of individual (relative) orientations of network components for sham, 4pMI, and 8pMI groups. Dashed lines represent Gauss fits. The majority of network components correspond either to longitudinal (0°) or transversal (90°) orientations (marked by red dotted lines). C, Difference integrals showing changes between indicated treatment groups. For instance, the difference integral between 4pMI and sham (left, 4pMI-sham) shows a relative increase in longitudinal (0°) and a decrease in transversal (90°) component orientations during early HF development. D, Bar graphs summarizing average amount of TT network components for sham, 4pMI, and 8pMI data. Left, Total network length normalized to cell area. Center, Total component lengths normalized to cell area, each for longitudinal (0°), transversal (90°), and oblique (±45°) orientations. Right, Number of triple junctions composed of 3 individual components normalized to cell area. *P<0.05 versus sham; n.s. indicates not significant.

