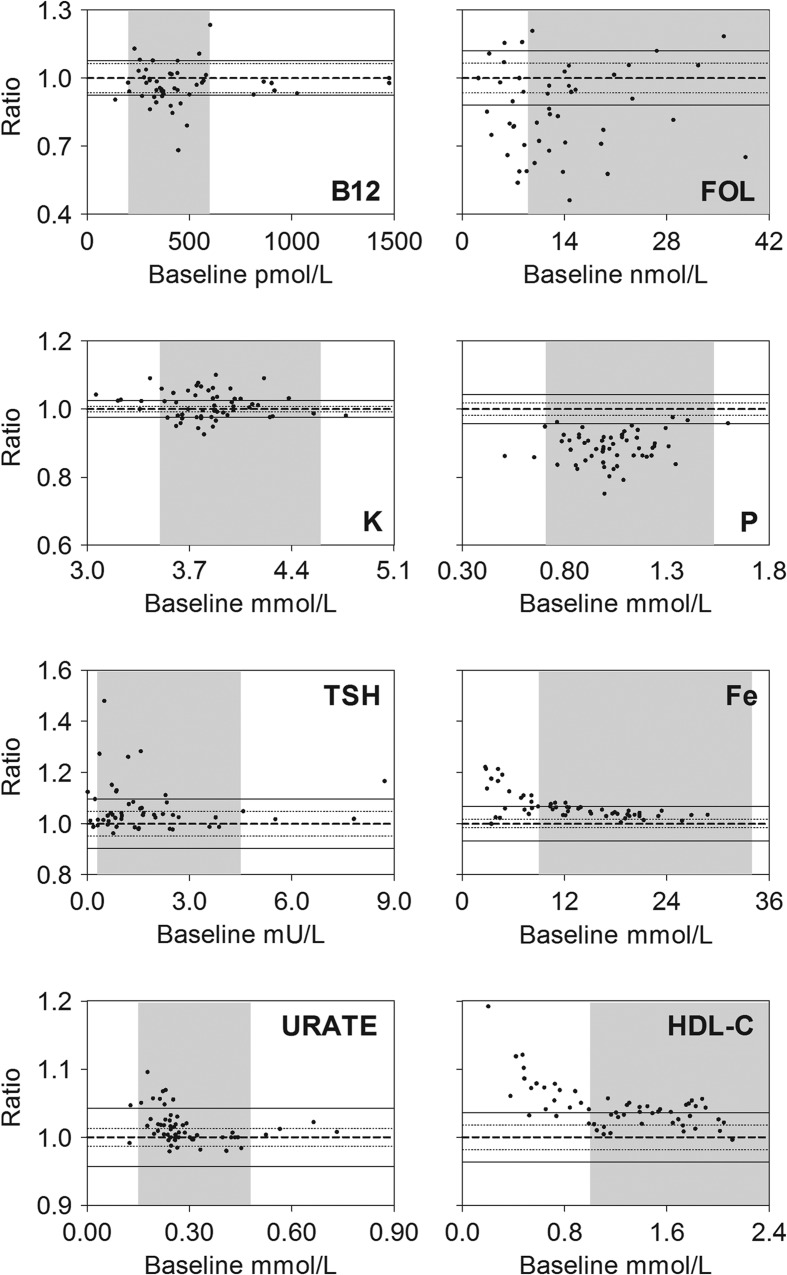
Figure 2.
Bland-Altman plots of results obtained after storage of whole blood (in lithium-heparin or serum tubes) for 10 h prior to analysis as compared to results at baseline. Fraction: Ratio between baseline results and results at 10 h. Indicated on each figure is the line of identity, i.e. baseline/10 h = 1.0 (bold dashed line), the analytical CV (thin dashed line), goal-CV (full drawn thin line) and the reference interval (shaded area). Data for analytical- and goal-CVs are indicated for each analyte in Table II.

