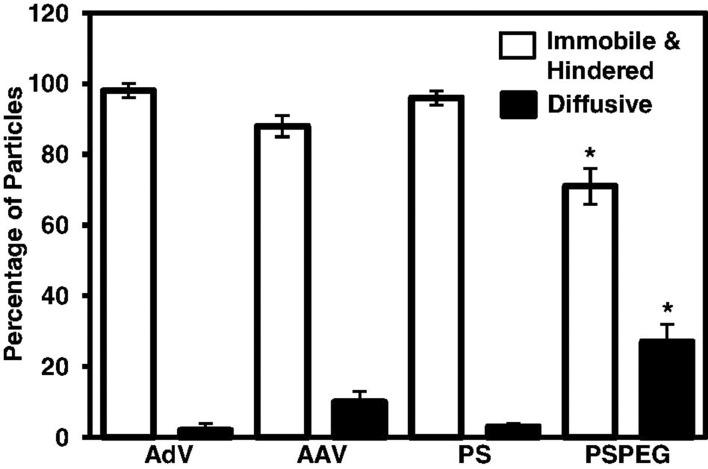
Figure 3.
Transport mode distributions of adenovirus (AdV) adeno-associated virus (AAV5, serotype 5), muco-adhesive PS control nanoparticles (PS) and muco-inert control PS-PEG nanoparticles. Particles were classified into either (i) immobile or hindered and (ii) diffusive. Mean ± SD are shown. *Statistically significant difference when compared with AAV5, AdV or PS within the same transport mode classification (p < 0.05). Redrawn using data from Ref. [41].

