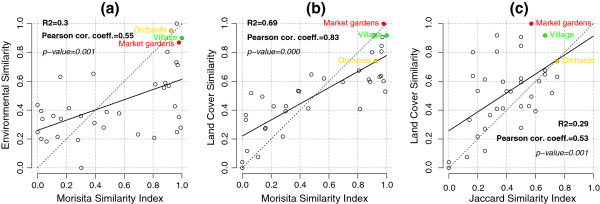
Figure 5.

Environmental similarities vs. Morisita or Jaccard index for significant Pearson correlation coefficients. a) Environmental similarity for all unique pairs of sites, by considering all the environmental factors jointly and as a function of the Morisita index; b) Land cover/use similarity as a function of the Morisita index; c) Land cover/use similarity as a function of the Jaccard index. The dotted line corresponds to the ideal case where similarities are equal. The continuous line corresponds to the linear regression result; the associated R2, Pearson correlation coefficient and p-value are shown at the top left. Points corresponding to the same landscape context are labelled with the name of context.
