
Figure 1.
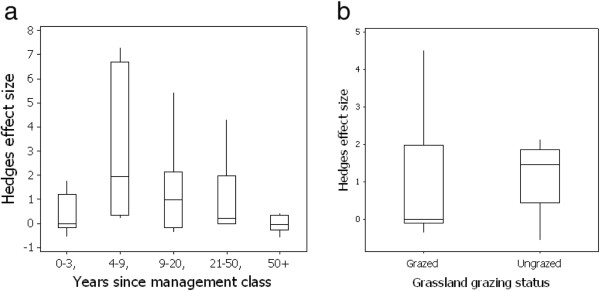
Box plot of the effect size of earthworm population change in paired arable and transitioned grassland plots classified to (a) categories based on time elapsed since conversion from arable to grassland and (b) grazing status of the converted grassland. Boxes indicate lower and upper quartile values, mid line the geometric mean and whiskers the 95% confidence intervals.