
Figure 5.
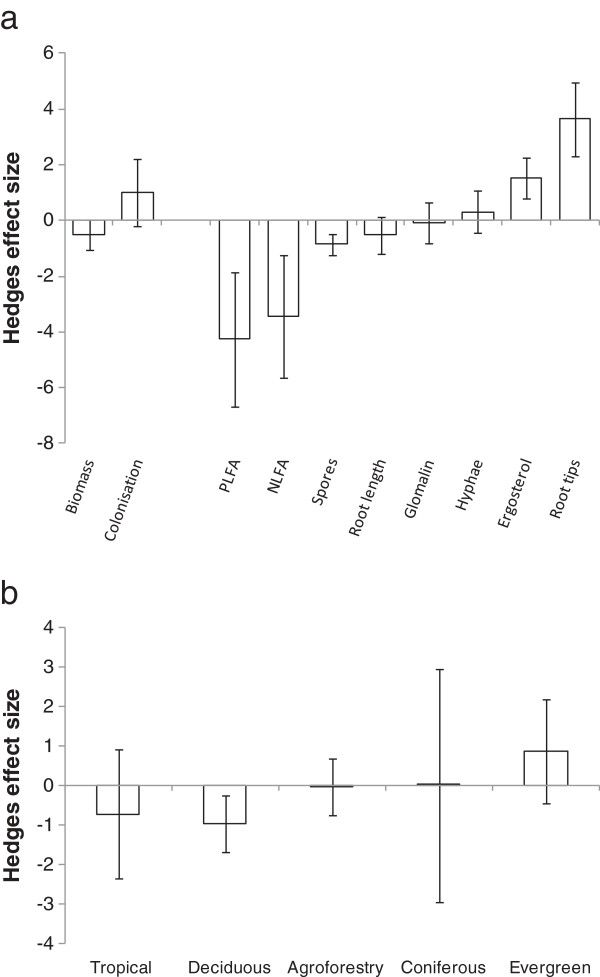
Effect size for fungal community metrics under (a) paired grassland and woodland plots and (b) for all community parameters between different woodland classes. Bars represent 95% confidence intervals.
Official websites use .gov
A
.gov website belongs to an official
government organization in the United States.
Secure .gov websites use HTTPS
A lock (
) or https:// means you've safely
connected to the .gov website. Share sensitive
information only on official, secure websites.
Effect size for fungal community metrics under (a) paired grassland and woodland plots and (b) for all community parameters between different woodland classes. Bars represent 95% confidence intervals.