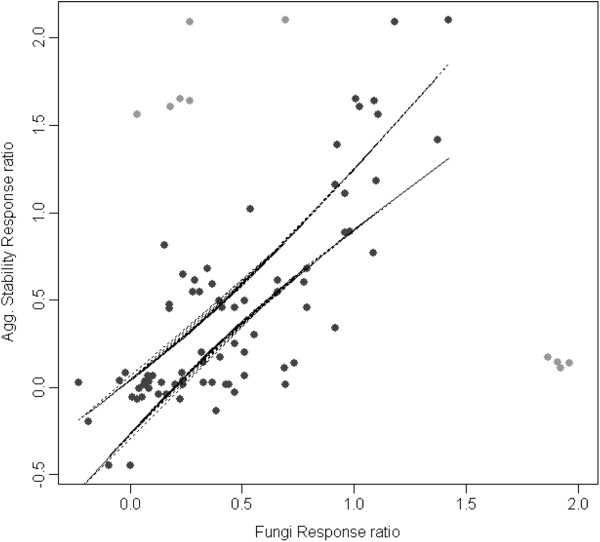
Figure 7.

Relationship between response ratios (Ln[×2/X’s]) of fungal biomass metrics and aggregate stability measures across land use transitions. Light grey data-points were not included in the calculation of 95% confidence intervals (dashed lines) as assessed by Studentised residuals and Cooks distance.
