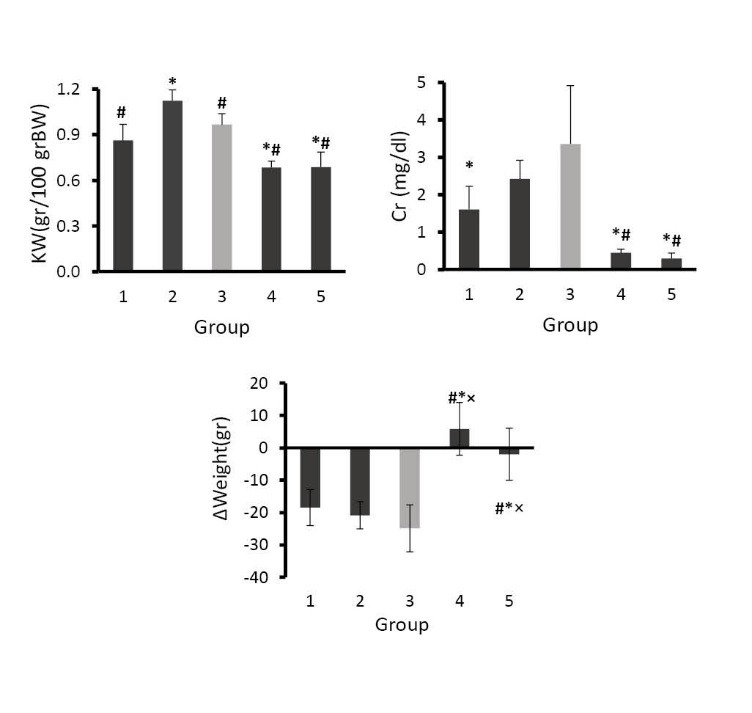
Figure 1 .

The data for serum level of creatinine (Cr, above right), total kidney weight (g)/100 (g) body weight (KW, above left), delta weight (∆W, weight difference, below), in five experimental groups (see text for group details). One-way ANOVA was applied for analyses. (*), (#) and (×) indicate significant difference (p<0.05) when compared with the positive control (group 3), group 2, and group 1, respectively.
