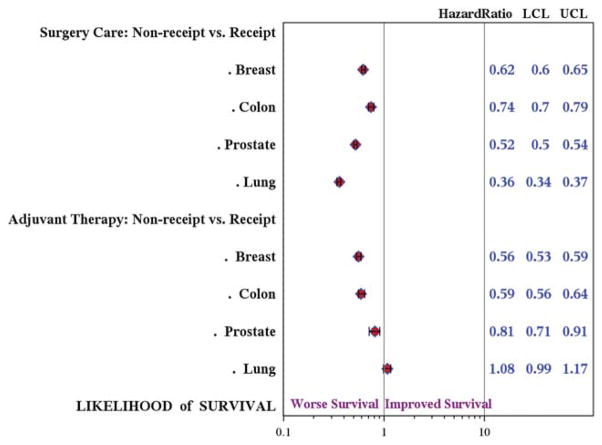
Figure 2.
The association between receipt of optimal care and survival is illustrated. Cox proportional hazards regression modeling was used to estimate the adjusted hazard ratios associated with receipt of Metric 1 (surgery/primary care) and Metric 2 (adjuvant therapy). The models were adjusted for race; age at diagnosis; Surveillance, Epidemiology, and End Results registry site; year of diagnosis; cancer stage; and Charlson Comorbidity Index. LCL indicates lower control limit; UCL, upper control limit.

