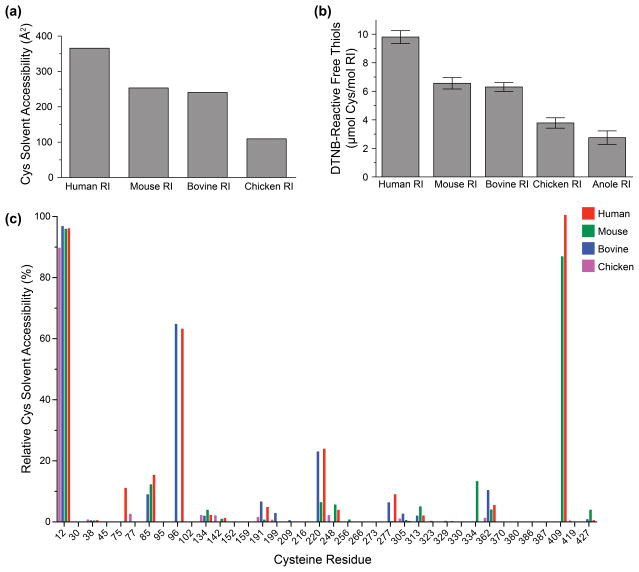
Fig. 7.
Comparison of cysteine residues of homologous RIs. (a) Combined solvent-exposed surface area for cysteine residues, as calculated from crystal structures with PyMOL. (b) Quantitation of solvent-exposed thiol groups in recombinant proteins, based on reaction with dithionitrobenzoic acid. (c) Relative solvent accessibility calculations for each cysteine residue in human, mouse, bovine, and chicken RIs.

