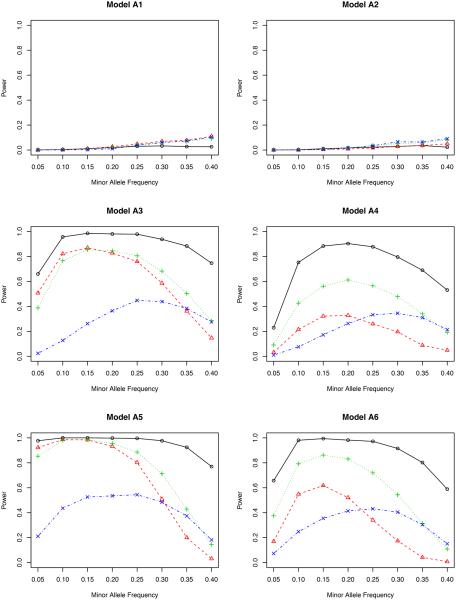
Figure 4.
Power versus minor allele frequency for bivariate phenotypes. The significance level is 5 × 10⁻⁷. The genotype is simulated using model BIN. Solid line with circles: inverse probability weighted test ; dashed line with triangles: non-weighted test T; dotted line with pluses: covariate weighted test TW,1; dotdash line with crosses: propensity score weighted test TW,2.

