
Figure 3. OCT serial images of a calibrated drop of the lipid-based tracer (35 µl, castor oil 0.5%) on a glass slide.
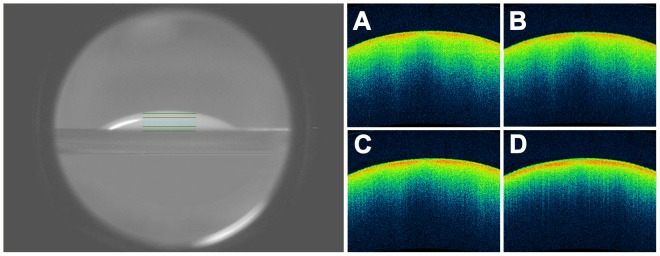
Infrared image (left), and horizontal, 3-mm OCT scans (right). The OCT scans were performed at instillation, at the 5th, at the 10th and at the 15th minute (A, B, C and D, respectively). No changes in reflectivity of the tracer were observed in this control sequence of contrasted-enhanced OCT imaging.