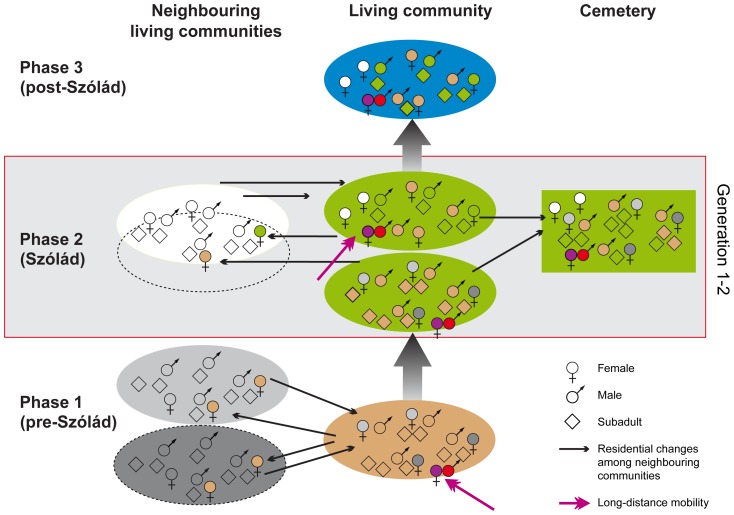
Figure 6. Model of the Szólád community's residential changes and occupation of the cemetery.
The background colours symbolise the different Sr isotope baseline values of the settlement locations. The symbols for the females, males and subadults are marked with the colour of the locality of their childhood. The colours red and purple denote long-distance migrants. Individuals with shades that differ from the background are non-local to the locations they are mapped in. The model is a hypothetical explanation of the occupation of the Szólád cemetery with local and non-local individuals in line with the strontium isotope data distribution (graphics: D. Peters, C. Knipper).

