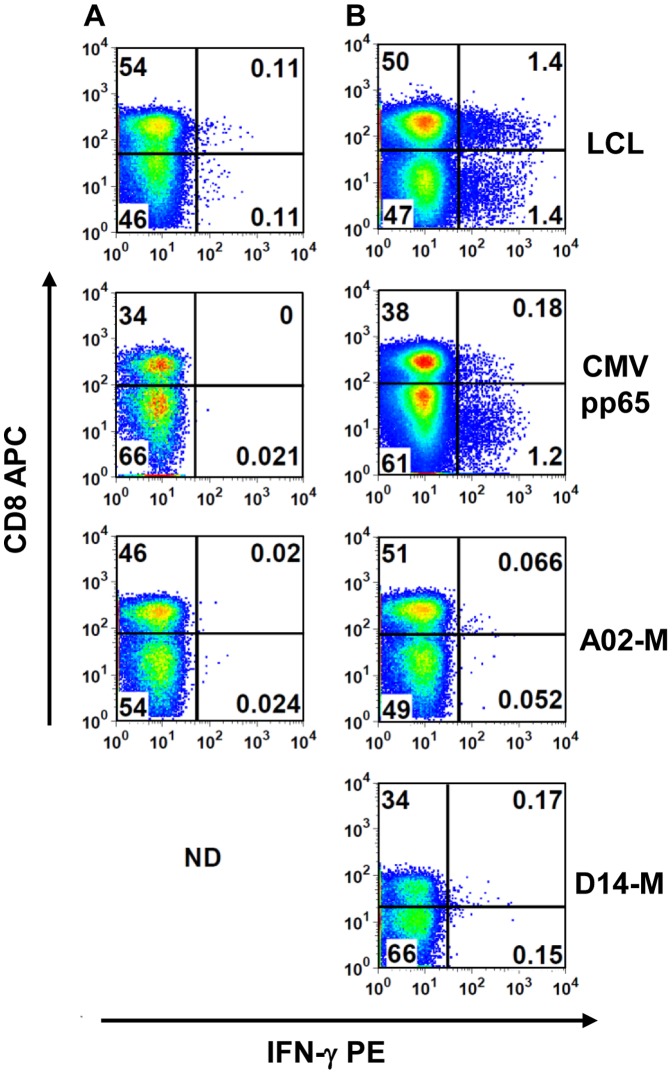
Figure 3. Detection of antigen-specific effector T cells ex vivo.
IFN-γ production measured by the capture assay in (A) unstimulated PBMC samples and (B) PBMC from healthy donors stimulated with the autologous lymphoblastoid cell line (LCL) or CMV pp65 (top two panels), or PBMC from melanoma patients A02 or D14 stimulated with autologous melanoma cells (bottom two panels), as indicated. Cells were gated on the single cell, low scatter, viable, CD14–CD16–CD19– subpopulation. Percentages are shown in each quadrant; ND = not done.

