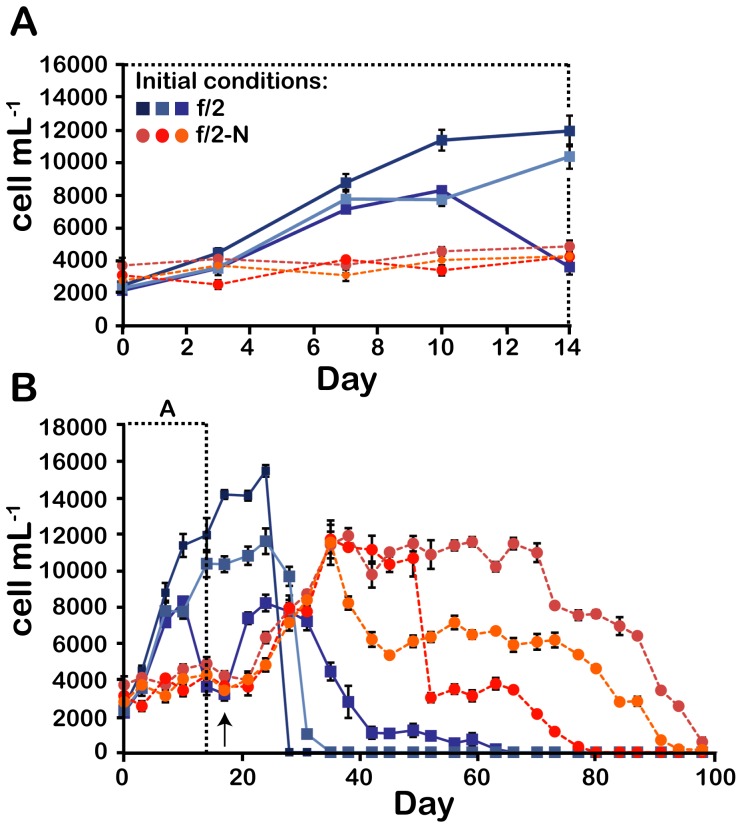
Figure 1. Growth of N-replete and N stressed cultures.
The cell density in 6 independent cultures, 3 supplemented with 880 µM NaNO3 - (f/2) and 3 without added N (f/2-N), was assessed until no swimming cells remained in the culture flasks. The first 14 days are shown on an expanded time scale (A) or over the 100 days of the experiment. The time at which 880 µM NaNO3 - was added to all cultures is shown by a black arrow. Results are mean ± SE of 3 technical replicates made on cell counts.

