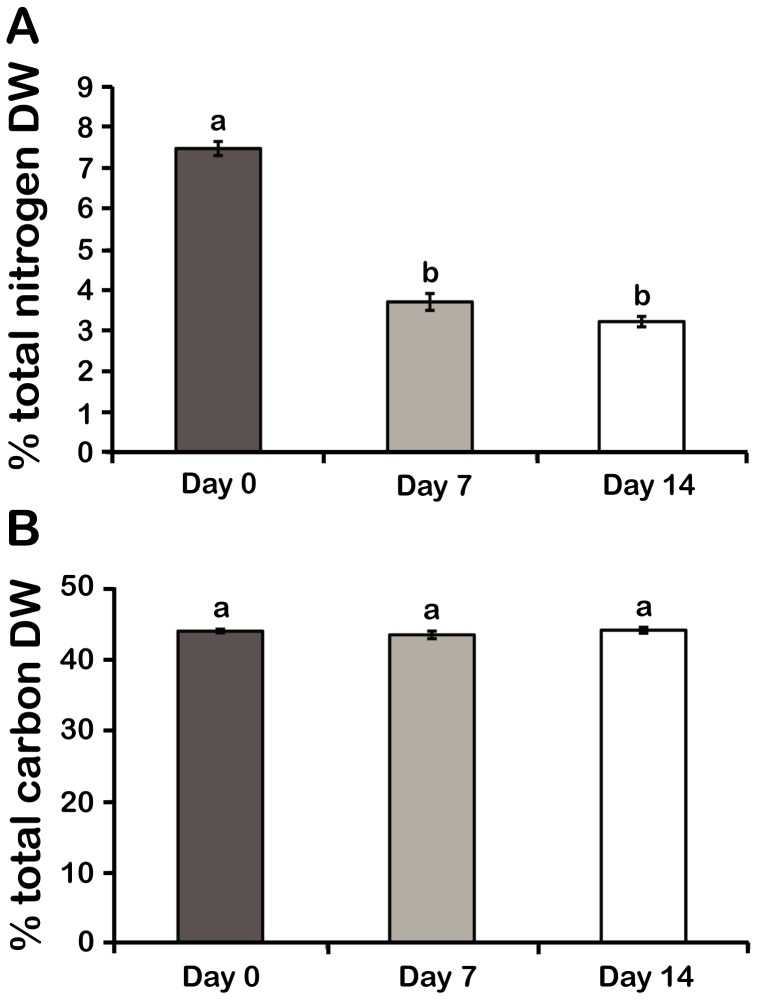
Figure 2. Elemental analysis shows a decreased N content in N stressed cells without a change in their C content.
(A) Dry weight percent of total N and B) total C. Results are mean ± SE (n = 3). Statistically different results (p<0.05) are marked with a different letter (Analysis of variance). DW; Dry weight.

