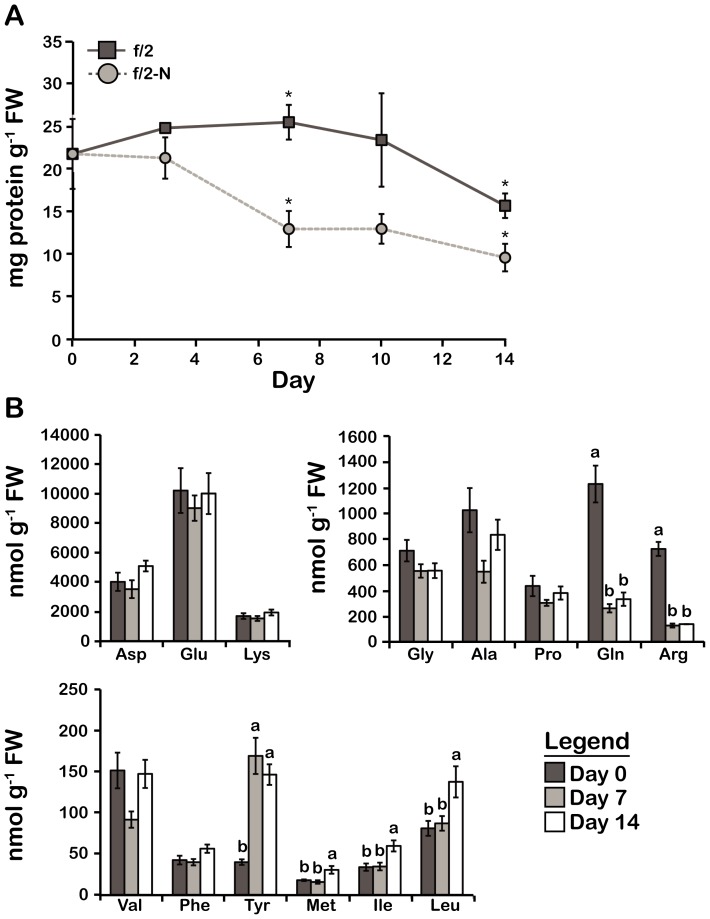
Figure 3. Changes in the total protein content and free amino acid profile in N stressed cells are consistent with a decrease in N assimilation.
A) Total protein content. B) Free amino acids, classified into three groups based on their relative abundance. Results are mean ± SE (n = 3). Statistically different results (p<0.05) are marked using either a different letter (Analysis of variance) or an asterisk (Student's t-test). FW; Fresh weight.

