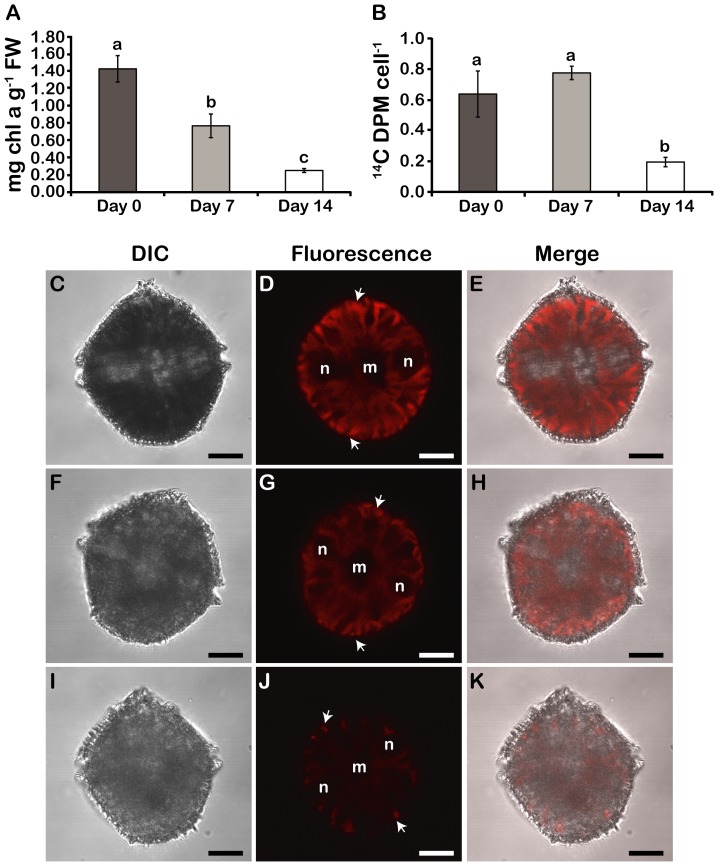
Figure 4. Photosynthesis decreases in N stressed cells.
A) Chlorophyll a levels. FW; Fresh weight. B) Photosynthetic rates of 14C fixation. Results are mean ± SE (n = 3). Statistically different results (p<0.05) are marked with a different letter (Analysis of variance). (C–K) DIC, chlorophyll autofluorescence and merged images of day phase cells at day 0 (C–E), day 7 (F–H) and day 14 (I–K). Chlorophyll intensity is highest in the periphery of day phase cells cells (white arrows) due to a separation of Rubisco and the light harvesting peridinin-chlorophyll a-protein within individual chloroplasts (Nassoury et al., 2001). All cells were pictured from a ventral view. In this orientation, two ends of the C-shaped nucleus (n) surround the centrally located ER and Golgi membranes (m). Scale bars are 10 µm.

