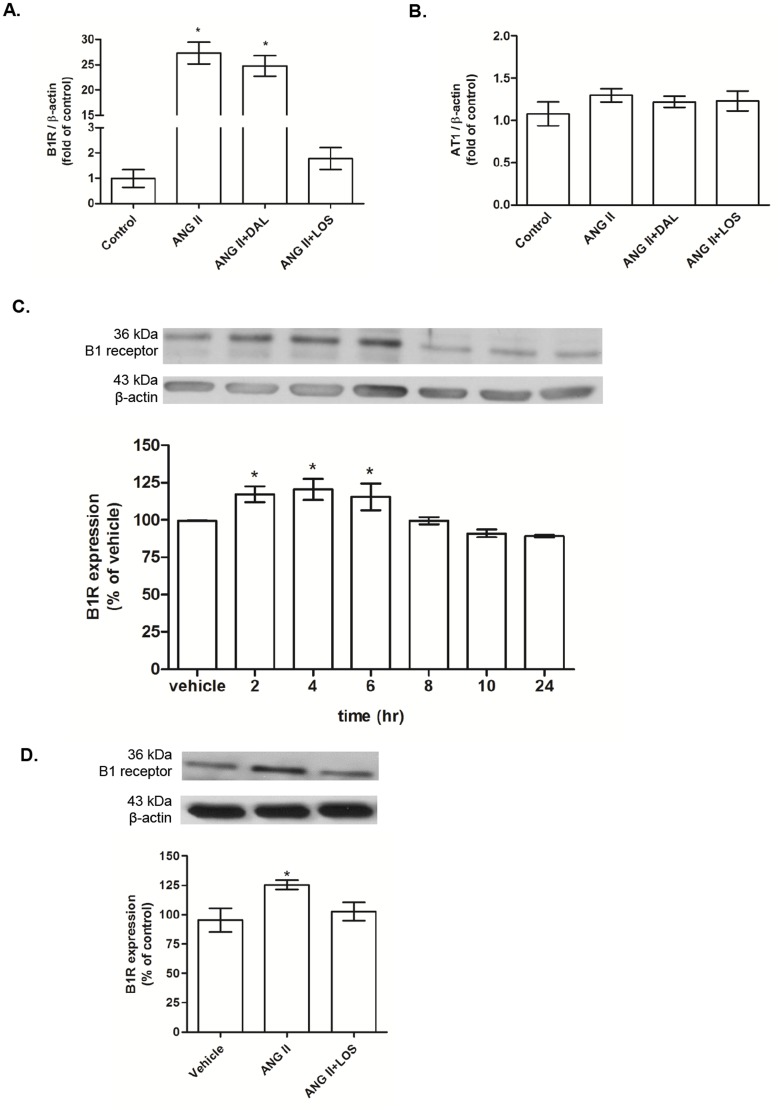
Figure 1. B1 and AT1 receptors expression in aorta and aortic smooth muscle cells (VSMC) primary culture.
Bar graph shows B1 receptor (B1R) [A] and AT1 receptor [B] mRNA levels in aortas from control, ANG II (400 ng/Kg/min), ANG II (400 ng/Kg/min) + DAL (350 ng/Kg/min) and ANG II (400 ng/Kg/min) + LOS (10 mg/Kg/day) rats. The receptors mRNA expression was calculated from the cycle threshold (Ct) value using the Δ2Ct method for quantification. Values were normalized against β-actin mRNA. Data represented mean±SEM; n = 5–7 for each group; *P<0.05 vs control. [C] Bar graph shows the temporal effects of ANG II (100 nM, 0–24 h) on protein B1R expression in aortic VSMC. [D] Bar graph shows B1R expression in aortic VSMC after stimulation with ANG II (100 nM, 2 h), in the presence or not of AT1 antagonist, losartan (LOS – 10 µM). B1R expression was normalized against the housekeeping protein β-actin. Data are presented as mean±SEM of 4 experiments. *P<0.05 vs. control.

