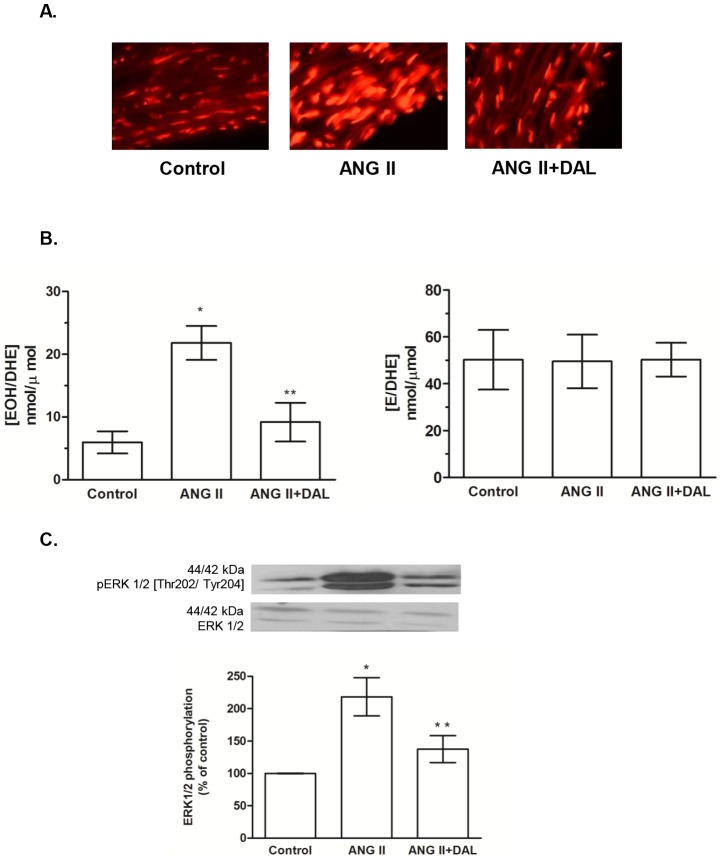
Figure 2. B1 receptor antagonism prevented angiotensin II (ANG II) effect in aorta.
[A] Fluorescence microscopy of aortic transverse sections after incubation with DHE. [B] Ratios of 2-hydroxyethidium/dihydroethidine (EOH/DHE) and ethidium/dihydroethidine (E/DHE) obtained by HPLC analysis from aortic segments. Data are expressed as mean ± SEM of 5 rats for each group. *P<0.05 vs control and **P<0.05 vs. ANG II [C] Bar graph shows the ratio of phosphorylated/total ERK1/2 that was used as an indicator of ERK1/2 activity. Data are expressed as mean ± SEM of 6 rats for each group. *P<0.05 vs control and **P<0.05 vs. ANG II.

